adding a mocked class for Config.
Adding device type to Device struct. Will eventually be needed for raid drives.
adding End-to-end testing capabilties.
Added testdata json files for webserver requests.
Seperated Start code and Setup code in webapp so we can test.
renamed "smart_attributes" to "ata_attributes" - Backwards incomatible change.
Added front end device sorting (red, yellow, green)
show unknown icon/status if drive has no smart data yet.
Moved all attribute "getters" into the controller.
created a device-sort pipe.
scrutiny
WebUI for smartd S.M.A.R.T monitoring
NOTE: Scrutiny is a Work-in-Progress and still has some rough edges.
Introduction
If you run a server with more than a couple of hard drives, you're probably already familiar with S.M.A.R.T and the smartd daemon. If not, it's an incredible open source project described as the following:
smartd is a daemon that monitors the Self-Monitoring, Analysis and Reporting Technology (SMART) system built into many ATA, IDE and SCSI-3 hard drives. The purpose of SMART is to monitor the reliability of the hard drive and predict drive failures, and to carry out different types of drive self-tests.
Theses S.M.A.R.T hard drive self-tests can help you detect and replace failing hard drives before they cause permanent data loss. However, there's a couple issues with smartd:
- There are more than a hundred S.M.A.R.T attributes, however
smartddoes not differentiate between critical and informational metrics smartddoes not record S.M.A.R.T attribute history, so it can be hard to determine if an attribute is degrading slowly over time.- S.M.A.R.T attribute thresholds are set by the manufacturer. In some cases these thresholds are unset, or are so high that they can only be used to confirm a failed drive, rather than detecting a drive about to fail.
smartdis a command line only tool. For head-less servers a web UI would be more valuable.
Scrutiny is a Hard Drive Health Dashboard & Monitoring solution, merging manufacturer provided S.M.A.R.T metrics with real-world failure rates.
Features
Scrutiny is a simple but focused application, with a couple of core features:
- Web UI Dashboard - focused on Critical metrics
smartdintegration (no re-inventing the wheel)- Auto-detection of all connected hard-drives
- S.M.A.R.T metric tracking for historical trends
- Customized thresholds using real world failure rates
- Temperature tracking
- Provided as an all-in-one Docker image (but can be installed manually)
- (Future) Configurable Alerting/Notifications via Webhooks
- (Future) Hard Drive performance testing & tracking
Getting Started
Docker
Until our Sponsor goal is reached, we are unable to use Docker Hub. In the meantime, Scrutiny Docker Image(s) will be attached to the latest Scrutiny Github Release
Download the docker-analogj-scrutiny-v0.1.2.tar file, and load it into your Docker daemon:
docker load < docker-analogj-scrutiny-v0.1.2.tar
docker images | grep analogj/scrutiny
If you're using Docker, getting started is as simple as running the following command:
docker run -it --rm -p 8080:8080 \
-v /run/udev:/run/udev:ro \
-v /dev/disk:/dev/disk \
--name scrutiny \
--privileged analogj/scrutiny
/run/udevand/dev/diskare necessary to provide the Scrutiny collector with access to your drive metadata.--privilegedis required to ensure that your hard disk devices are accessible within the container (this will be changed in a future release)analogj/scrutinyis a omnibus image, containing both the webapp server (frontend & api) as well as the S.M.A.R.T metric collector. (dedicated images will be available in a future release)- If you do not have access to the
analogj/scrutinydocker image, please contact me using the email address in my profile: @analogj Please include your Github username and when you sponsored me. (eventually both images and source code will be open sourced)
Usage
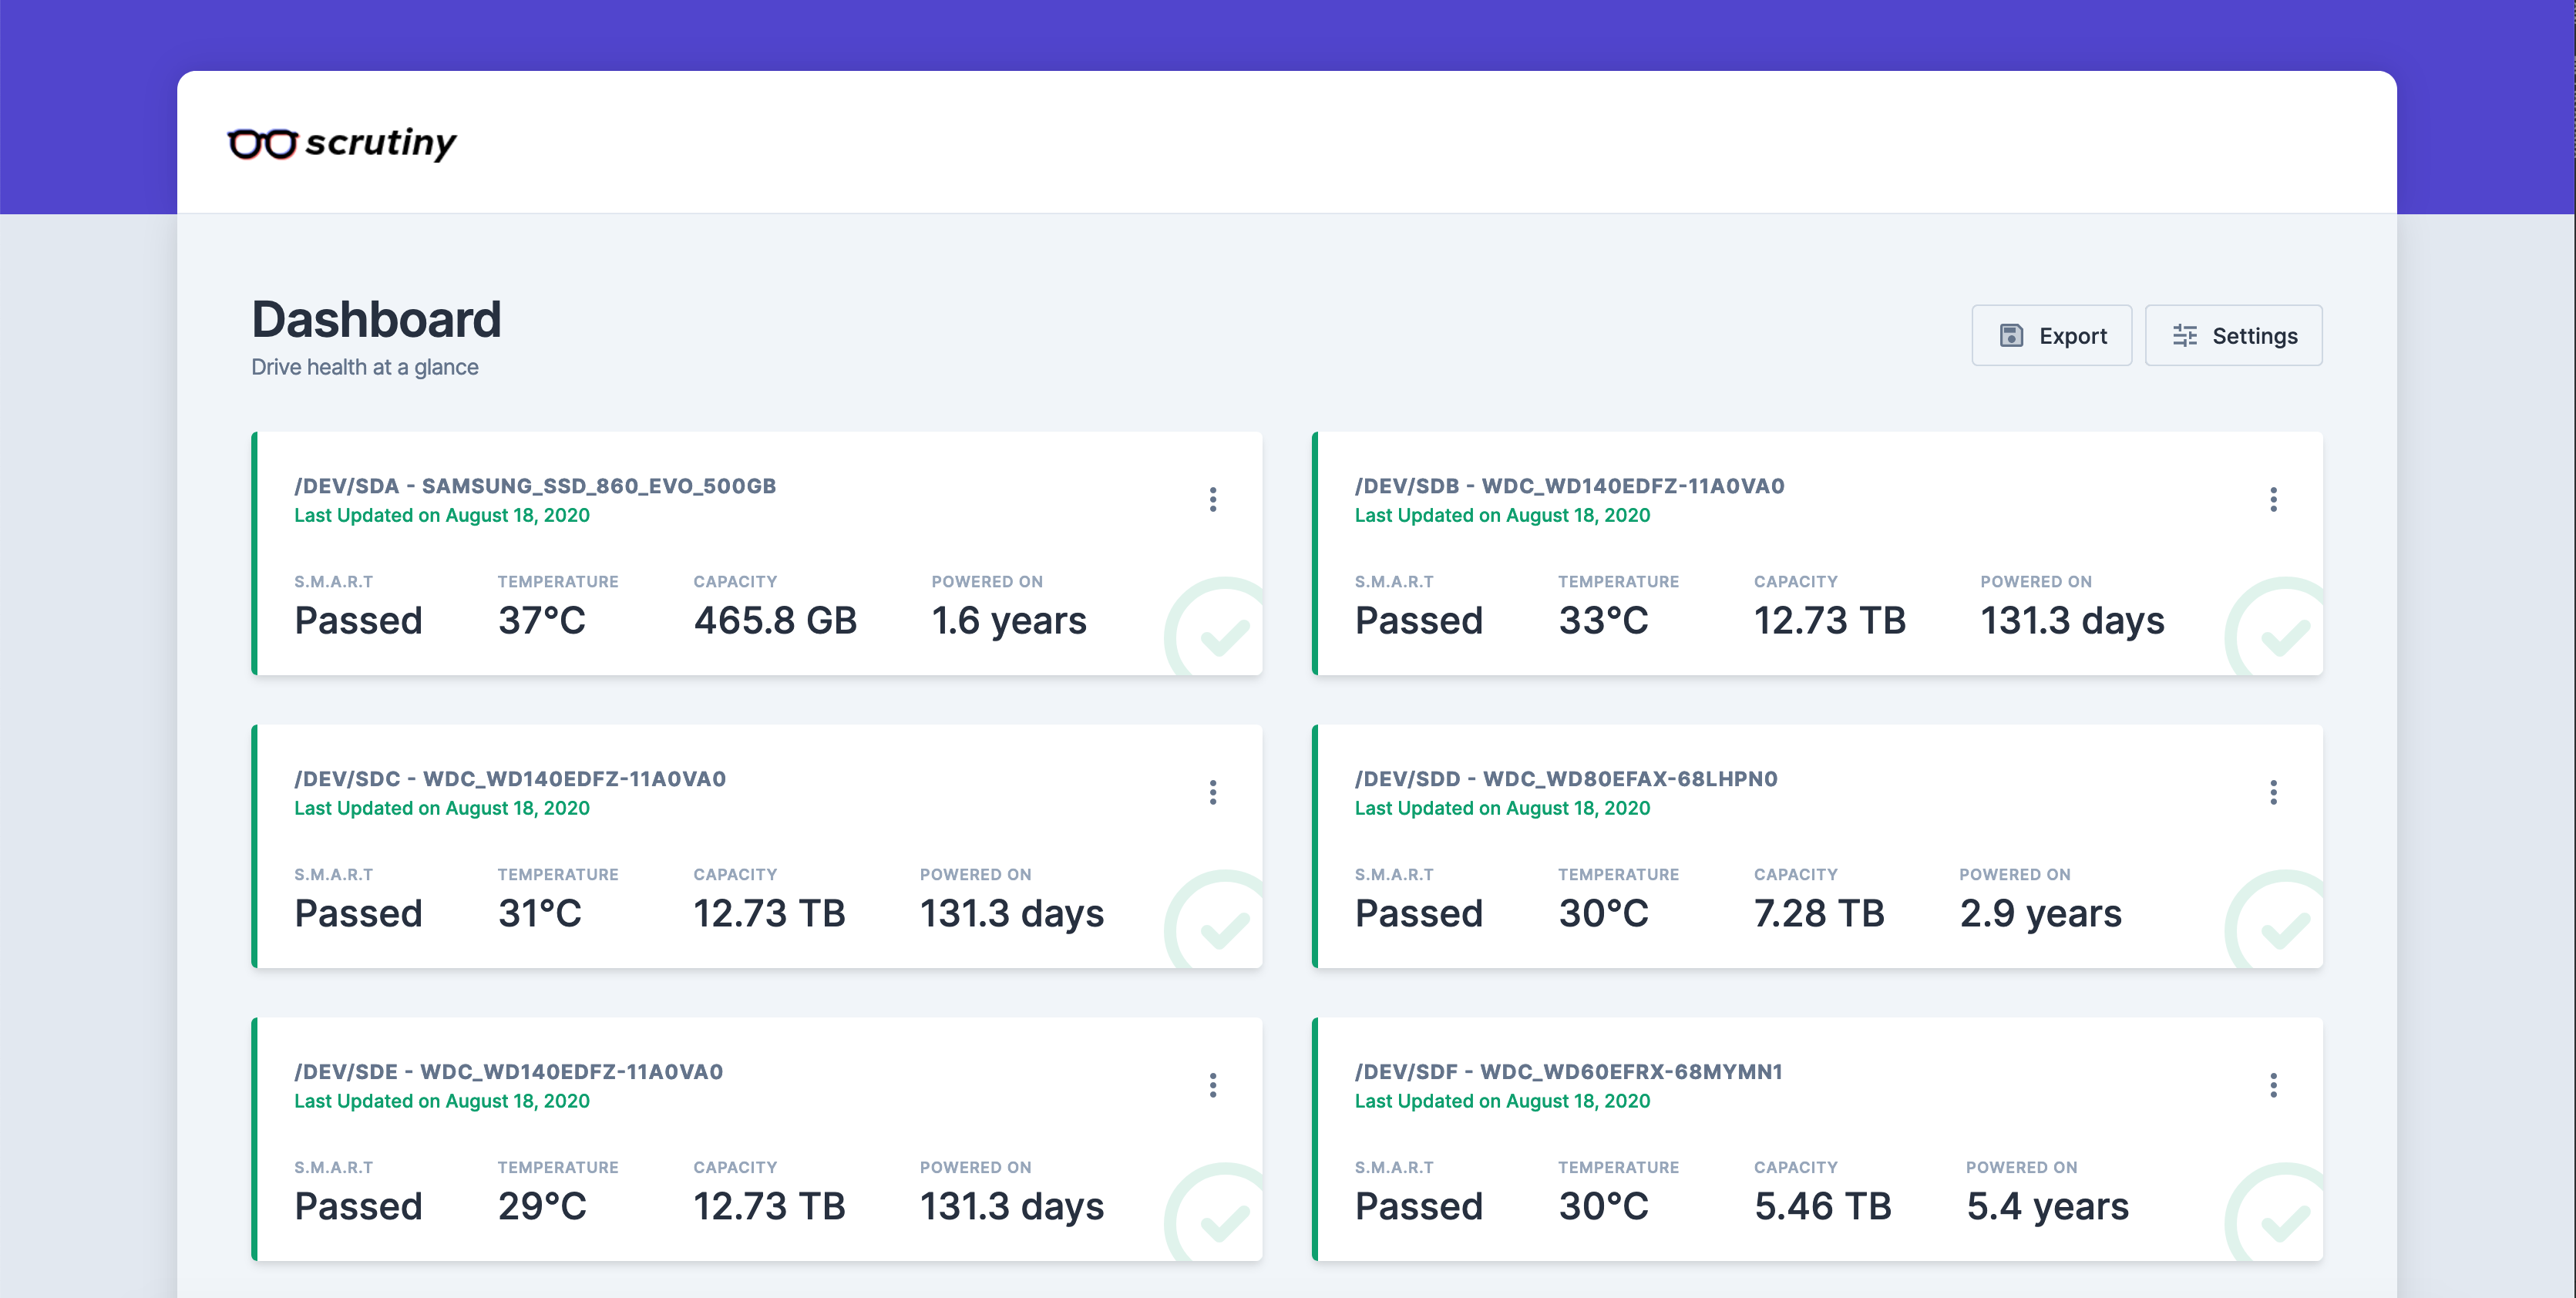
Once scrutiny is running, you can open your browser to http://localhost:8080 and take a look at the dashboard.
Initially it will be empty, however after the first collector run, you'll be greeted with a list of all your hard drives and their current smart status.
The collector is configured to run once a day, but you can trigger it manually by running the following command
docker exec scrutiny /scrutiny/bin/scrutiny-collector-metrics run
Configuration
We support a global YAML configuration file that must be located at /scrutiny/config/scrutiny.yaml
Check the example.scrutiny.yml file for a fully commented version.
Contributing
Please see the CONTRIBUTING.md for instructions for how to develop and contribute to the scrutiny codebase.
Work your magic and then submit a pull request. We love pull requests!
If you find the documentation lacking, help us out and update this README.md. If you don't have the time to work on Scrutiny, but found something we should know about, please submit an issue.
Versioning
We use SemVer for versioning. For the versions available, see the tags on this repository.
Authors
Jason Kulatunga - Initial Development - @AnalogJ
License
All Rights Reserved
Note: This license will change once certain sponsorship conditions are met. Please see the reddit announcement post for more information.